联系我们
简单又实用的WordPress网站制作教学
当前位置:网站首页 > 程序开发学习 > 正文

vue2中实现Antv g6 流程图 以及自定义节点

作者:小教学发布时间:2023-10-03分类:程序开发学习浏览:89


导读:本案例antvg6版本:"@antv/g6":"^3.4.8",效果:1.引入antvg6和echarts差不多<...

本案例 antv g6版本: "@antv/g6": "^3.4.8",

效果:
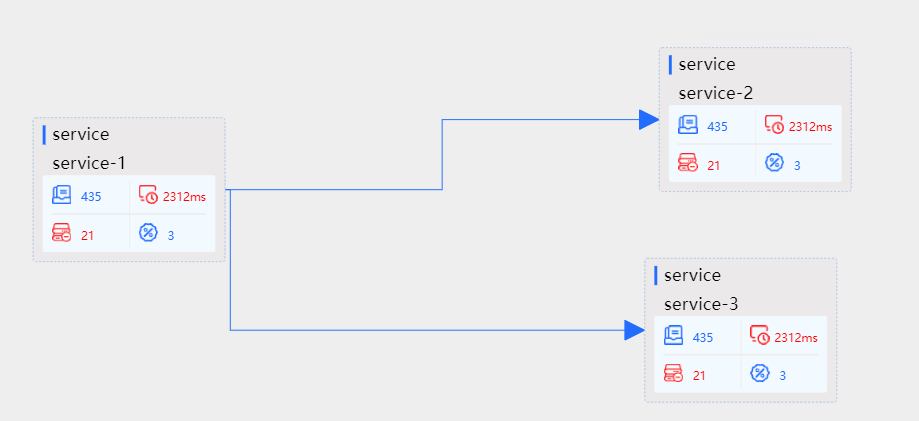


1.引入antv g6和echarts差不多

  <div class="line">
     <div id="mountNode"></div>
  </div>
<script>
import G6 from '@antv/g6';
export default {
    data(){
        return{
        
            // 拓扑数据结构
            // 定义数据源
         data:{
            "nodes": [
              {
                "id": "1",
                "name": "service-1",
                "type": "service",
                "statistics": {
                  "trace_num": 435,
                  "duration_avg": 2.312,
                  "alert_num": 21,
                  "situation_num": 3
                }
              },
              {
                "id": "2",
                "name": "service-2",
                "type": "service",
                "statistics": {
                  "trace_num": 435,
                  "duration_avg": 2.312,
                  "alert_num": 21,
                  "situation_num": 3
                }
              },
              {
                "id": "3",
                "name": "service-3",
                "type": "service",
                "statistics": {
                  "trace_num": 435,
                  "duration_avg": 2.312,
                  "alert_num": 21,
                  "situation_num": 3
                }
              }
            ],
            "edges": [
              {
                "source": "1",
                "target": "2",
                "edge_type": "deploy"
              },
              {
                "source": "1",
                "target": "3",
                "edge_type": "deploy"
              }

            ]
          },
        }
    },
    created(){
    
     
    },
    mounted(){
      this.initG6();
    },
    methods:{
     
    //  业务数据拓扑图
         initG6(){
               const that = this;
            G6.registerNode(
                "service", //第一个参数自定义节点的名字
                // 第二个参数是这个节点的图形分组
                {
                draw: function (cfg,group){
                //根据数据动态改变颜色或者图片
                    let colortext2=cfg.statistics.duration_avg>1 ?"red" :"#226DFF";
                  let img2=cfg.statistics.duration_avg>1 ?require('../../../../../assets/shouye备份1.png') :require('../../../../../assets/shouye备份.png');
                  let colortext3=cfg.statistics.alert_num>20 ?"red" :"#226DFF";
                  let img3=cfg.statistics.alert_num>20 ?require('../../../../../assets/a-fuwuqilan2.png') :require('../../../../../assets/fuwuqilan.png');

                    // 增加一个图像 最外边的虚线框
                   let keyShape=group.addShape('rect',{
                    //    代表矩形的一些属性
                       attrs:{
                        //    相对定位
                           x:0,
                           y:0,
                           width:200,
                           height:150,
                           stroke:"#B0C6E0",   //描边色
                           fill:"#EBE9E9",  //填充颜色
                           radius:3,
                           lineWidth:1,
                           lineDash:[2,2]  //设置虚线的样式
                           
                       },
                       name:"card-node-keyShape" //起个唯一名字便于识别
                    });
                  
                 
                    group.addShape("rect",{
                      attrs:{
                           x:10,
                           y:60,
                           width:180,
                           height:80,
                          //  stroke:"pink",   //描边色
                           fill:"#F3FAFF",
                           radius:3,   
                      },
                      name:"card-node-titleShape"
                    });
                    group.addShape("rect",{
                      attrs:{
                        x:100,
                        y:65,
                        width:1,
                        height:70,
                        fill:"#eee"
                      },
                      name:"card-node-line"
                    });
                    group.addShape("rect",{
                      attrs:{
                        x:20,
                        y:100,
                        width:160,
                        height:1,
                        stroke:"#eee",
                        fill:"#eee"
                      },
                      name:"card-node-heng"
                    });
                        group.addShape('rect',{
                      attrs:{
                        x:10,
                        y:8,
                        width:3,
                        height:20,
                        fill:"#226DFF", 
                      },
                      name:"card-node-border"
                    });
                    group.addShape('text',{
                      attrs:{
                        text:cfg.type,
                        x:20,
                        y:10,
                        fontSize:18,
                        fill:"block",
                        textBaseline:"top"
                      },
                      name:"card-node-serve"
                    });
                    group.addShape('text',{
                      attrs:{
                        text:cfg.name,
                        x:20,
                        y:40,
                        fontSize:18,
                        fill:"block",
                        textBaseline:"top"
                      },
                      name:"card-node-title"
                    });
                    // 业务模块
                    group.addShape("image",{
                      attrs:{
                        x:20,
                        y:70,
                        width:20,
                        height:20,
                        img:require('../../../../../assets/yewu1.png'),
                      },
                      name:"card-node-yewuico"
                    });
                        group.addShape("text",{
                      attrs:{
                        text:cfg.statistics.trace_num,
                        x:50,
                        y:90,
                        fill:"#226DFF"
                      },
                       name:"card-node-text1",
                    });
                    // 平均响应时长
                      group.addShape("image",{
                      attrs:{
                        x:110,
                        y:70,
                        width:20,
                        height:20,
                        img:img2,
                      },
                      name:"card-node-haoshiico"
                    });
                     group.addShape("text",{
                      attrs:{
                        text:cfg.statistics.duration_avg*1000+"ms",
                        x:135,
                        y:90,
                        fill:colortext2
                      },
                       name:"card-node-text2",
                    });
                    // 告警模块
                    group.addShape("image",{
                      attrs:{
                        x:20,
                        y:110,
                        width:20,
                        height:20,
                        // img: require('../assets/fuwuqilan.png'),
                        img:img3,

                      },
                      name:"card-node-fuwuqiico"
                    });
                      group.addShape("text",{
                      attrs:{
                        text:cfg.statistics.alert_num,
                        x:50,
                        y:130,
                        fill:colortext3
                      },
                       name:"card-node-text2",
                    });
                    // 故障模块
                     group.addShape("image",{
                      attrs:{
                        x:110,
                        y:110,
                        width:20,
                        height:20,
                        img:require('../../../../../assets/situation.png'),
                      },
                      name:"card-node-fuwuqiico"
                    });
                      group.addShape("text",{
                      attrs:{
                        text:cfg.statistics.situation_num,
                        x:140,
                        y:130,
                        fill:"#226DFF"
                      },
                       name:"card-node-text2",
                    });
                    return keyShape; 
                 },
                 
                },'rect'); //第三个参数,是如果没有设置样式,会默认继承rect的样式
              // 创建 G6 图实例
              
        const graph = new G6.Graph({
            container: 'mountNode', // 指定图画布的容器 id,与第 9 行的容器对应
            // 画布宽高
            width:1640,
            height:800,
             fitView: true, //自适应屏幕
             fitCenter: true, //屏幕中间
             modes:{
               default:['drag-canvas', 'zoom-canvas', 'drag-node']  //允许拖拽画布、缩放画布、拖拽节点
             },
        //设置默认节点
            defaultNode:{
            //这里直接使用上面自定义的节点
              type:"service"
            },
        //设置默认边的样式
            defaultEdge:{
              type:"polyline",
           
                style: {
                //按照官网的这样写报错,可能版本原因吧
                //  endArrow: {
                //     path: G6.Arrow.triangle(10, 20, 25),
                //     d: 25,
                //     },
                //这是网上找的一个写法,具体参数是如何实现我也不知道,自己可以都是试下
                 endArrow: {
                   path: 'M 0,0 L 20,10 L 20,-10 Z',
                    d: 0,
                   fill: '#226DFF',
                    // stroke: '#0f0',
                    // opacity: 0.5,
                    // lineWidth: 3,
                },
                  stroke:"#226DFF" , 
                
                },
            }
          });
          // 读取数据
          graph.data(this.data);
            //给节点添加点击事件
             graph.on('node:click', function(ev){
                        const shape = ev.name;
                        // const item = ev.item;
                            console.log("111",shape);
                            console.log("11111");
                            that.$router.push({
                                path:"/linkAnalysis/business/callChain",
                            })
                        });
          // 渲染图
          graph.render();
        }
    }
}
</script>

一定记得给盒子设置宽高

  .line{
          width: 95%;
          height: 800px;
          margin-left: 20px;
          margin-top: 20px;
          background-color: #eee;
          #mountNode{
            width: 100%;
            height:100%;
            }
      }

初学者一个,以上如有问题或者错误,多谢指出


标签:vue2中实现Antv g6 流程图 以及自定义节点_vue2实现流程图_Te Fuir201的博客


程序开发学习排行
最近发表
网站分类
标签列表